tech.jpg)

SPICE is a program for simulating electronic circuits, the name is an acronym that stands for "Simulation Program with Integrated Circuit Emphasis". Originally the program was created by Laurence Nagel at the Electronics Research Laboratory of the University of California. It was released as public-domain and the release included the source code, which then meant that it was possible to port the program to other systems, including the Amiga.
More information about the history and other versions of SPICE can be found on its Wikipedia page and on the SPICE download page of Berkeley University.
SPICE is a valuable tool when designing electronics. It provides an important step between creating the design and building the first prototype. Back in the early nineties when I was studying electronic design the use of SPICE was part of the curriculum. At home I used the Amiga version, which happened to be slightly newer than the version we used in class. And I still tend to use a descendant of the original program as part of my job, but now in the guises of LTspice and Ngspice that run on a modern PC.
The Amiga version I'm now going to use is version 3f5, which can be found on Aminet compiled for 68000 or for 68020 with FPU. This article is not intended as a tutorial, but more as an example of using the Amiga for productivity. I'll try not to get too technical.
Using SPICE 3f5
SPICE is a command line tool and takes a text file with a description of the electronic schematic as its input. The text file will also contain commands that describe the type of calculations SPICE needs to perform. After performing these calculations SPICE will print the result back to the CLI/Shell window by default.
The input file
The very first line of the input file is treated as the name of the circuit. Lines that start with an asterisk are treated as comments and skipped when the file is processed. Circuits are described by placing a component on each line with its connections and value(s).
The image below shows on the left a simple low-pass filter consisting of resistor R1 and capacitor C1. The input signal is produced by AC voltage source V1. Each node (connection point) in the circuit is given a number and these numbers are used in the input file to describe where each component in the circuit is situated. Below on the right the SPICE description for the circuit on the left is shown.
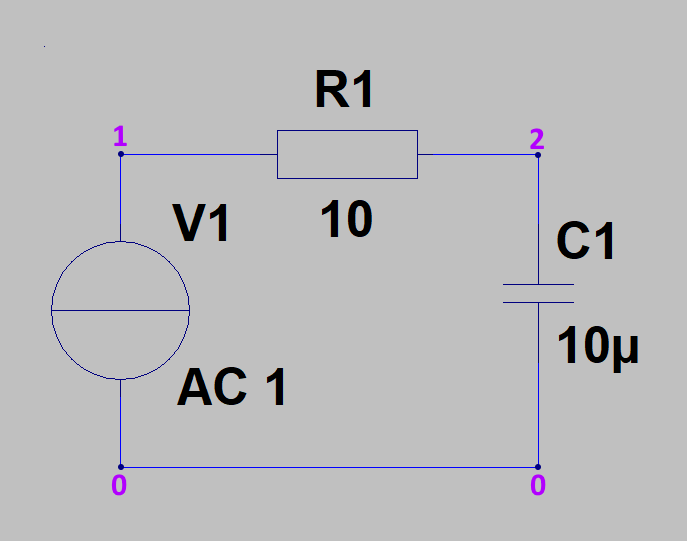
The description shows that R1 sits between node 1 and 2 and has a value of 10 Ohm. C1 sits between 2 and 0 and has a value of 10 micro Farad. The voltage source is connected to node 1 and 0, has no DC voltage, but has an AC voltage of 1 Volt.
The input file also contains the commands that tell SPICE what to calculate. Commands for SPICE always start with a period. In the example above the AC command is used to step the frequency of the AC signal from 10Hz to 100kHz and to do this in 10 steps for each decade - in this case there are four decades (10Hz to 100Hz, 100Hz to 1kHz, 1kHz to 10kHz and 10kHz to 100kHz) so there will be 40 calculation points.
Then the plot command tells SPICE that the resulting AC voltage on node 2 (the output node of the filter) is of interest and should be plotted to a graph.
The end command is there to indicate the end of the file.
The output
Older versions of SPICE would just take the input file as an argument and spit the output to the terminal. Newer versions (like the version 3f5 from Aminet) also have an interactive mode. To process the file like the older versions did, the "-b" argument is used:
> spice3f5 -b rc-filter.cir
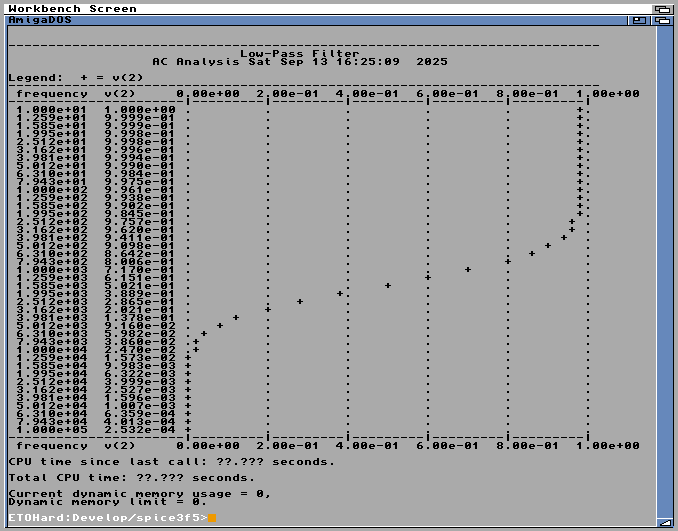
A screenshot of the output is shown below at the left. For the original UNIX version of SPICE this output was meant for a line-printer so that the graph looked fine when the printout was turned from portrait to landscape orientation. The image below on the right shows the same screenshot, but rotated counter-clockwise to give a similar effect.
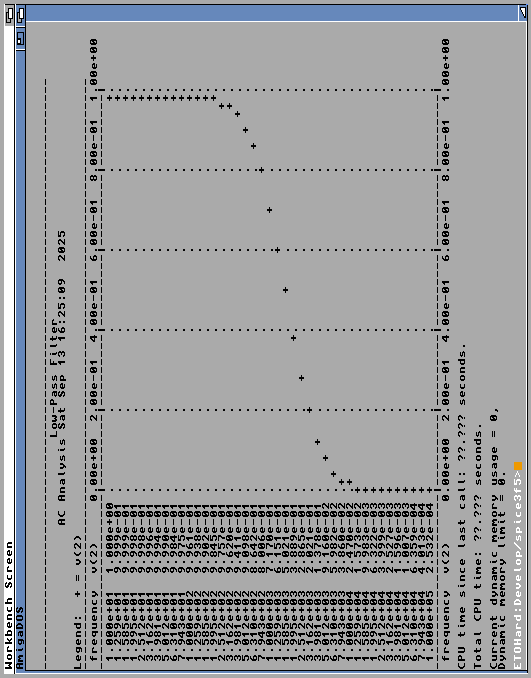
The graph on the rotated image shows the voltage on node 2 (the filter output) on the vertical axis and the increasing frequency from left to right on the horizontal axis. On the left hand side the AC voltage is passed on without any change, in the middle the filter removes more of the signal as the frequency goes up. At the right hand side nothing of the input signal is left on the output. As expected, the low-pass filter will only pass the low frequencies.
Interactive mode
SPICE 3f5 will go into interactive mode when it is started without the "-b" argument:
> spice3f5 rc-filter.cir
It will load the input file and then give a command prompt, which allows the user to give the program commands. To execute the calculation command in the input file run is typed on the SPICE command prompt. The prompt will return without any output if no issues were encountered running the command.
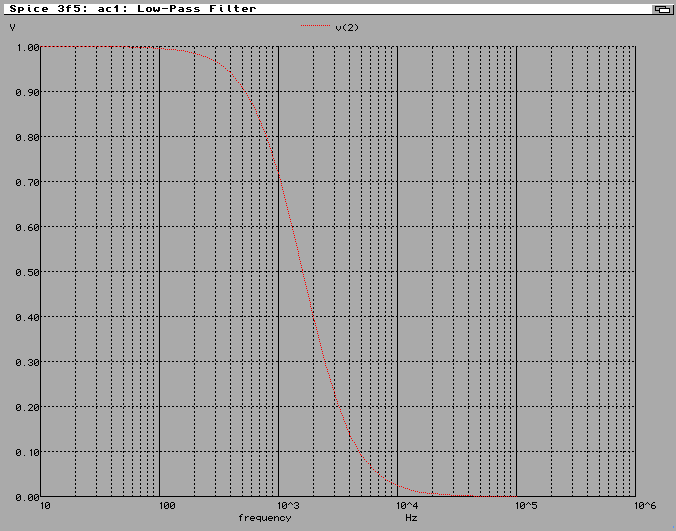
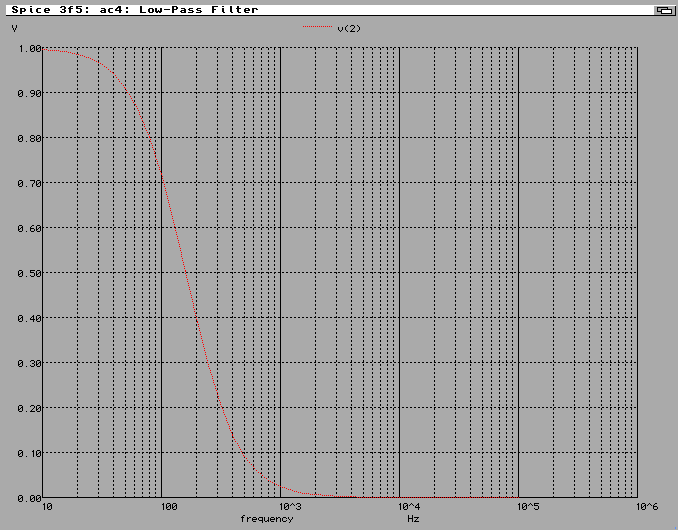
To see the output of the calculations the command plot v(2) is typed on the prompt. Again the prompt returns without printing anything, but this time a graphical screen will have opened behind(!) the Workbench screen showing the requested plot:
In interactive mode it is not required to have any commands in the input file. Instead of running the commands in the input file the user can just type the commands on the prompt to have SPICE do the calculations.
The interactive mode also allows the user to modify the values of the components in the circuit with the alter command. The following command sequence changes the value of R1 to 100 Ohm (it was 10 Ohm) then recalculates the frequence analysis and ends with plotting the new graph to see what effect changing the value of R1 had.
Spice 4 -> alter r1=100
Spice 5 -> ac dec 10 10 100k
Spice 6 -> plot v(2)
Press <return> to continue.
Spice 7 ->
SPICE will use the previously opened screen for the new plot, so it will ask to press <return> to continue before it erases the screen and draws a new plot on it. The plot with the new value of R1 is shown below. Increasing the value of R1 has moved the graph to the left, meaning that the filter starts working at a ten times lower frequency than before.
The interactive mode gives the user more flexibility to make changes and quickly see the result. It also allows the user to perform different types of calculations and see the output of those. Without the interactive mode each of these changes would require a modification to the input file, which makes it a bit more cumbersome - especially for complex circuits.
Here is an overview of a small number of SPICE commands. A full list of commands can be found on the Tclspice website, which is another SPICE3 implementation.
Other Amiga versions
The 3f5 version used here is not the only version of SPICE that is currently available on Aminet. There is an older version called ASpice on Aminet as well. This is a port of SPICE2 and this is the version I used when I was studying.
Another SPICE version that is available on Aminet is called AmiSPICEed. This version boasts a graphical editor for creating the circuits and that got me quite excited - this sounded like an Amiga version of something like LTSpice. But unfortunately I've not been able to get it to run properly on any of my systems. I tried different Kickstart versions, Workbench versions and even screen resolutions. The button images are always completely scrambled. That is a pity since it would have showcased one of the Amiga's strong points: the GUI.
Conclusion
The rules of nature have not changed and as such the results calculated by these older versions of SPICE are still correct. Since a lot of the newer versions of SPICE were built on top of SPICE3 a lot of information that is still available on the web is compatible with the way the Amiga version 3f5 works. Due to the lack of a graphical editor describing a complex circuit in a text file can be difficult, although a lot of modern CAD programs do have the option to export a circuit as a SPICE compatible netlist.
For my day job I'll continue to use modern versions like LTspice and Ngspice. For my less complex hobby projects I think I'll revisit the Amiga version of SPICE 3f5 more often. I may even have a look at using the Amiga to calculate through the BassMX frequency response. Something I used LTspice for during development.